Field Inspection
A complete walkthrough of the rewritten Field Inspection application — every screen, every panel, and every workflow a field inspector needs to get the job done in the field.
Overview
Field Inspection is a cross-platform mobile inspection management application built for code enforcement officers, permit inspectors, and municipal inspection staff. It brings the complete property inspection workflow out into the field, with full offline support and automatic background synchronization when connectivity returns.
What You Can Do
Core Workflows-
Search and Access ParcelsLook up any property by address, owner name, business name, SBL, or record number and pull up its complete history in seconds.
-
Manage Your Inspection CalendarSee every scheduled inspection at a glance in a monthly calendar view, filtered by type and by inspector.
-
Conduct Periodic InspectionsWork through digital checklists, record findings, log violations, document actions, and capture photos — all from one screen.
-
Track Complaints, Permits, and ApplicationsOpen and close complaints, review permit applications, manage issued permits through their full lifecycle, and attach supporting documents.
-
Manage Contacts and CommunicationKeep owners, occupants, and agents tied to the right parcels and records for easy follow-up.
-
Work Offline With ConfidenceThe app stores everything locally and queues your changes. When you're back in range, everything syncs automatically without interrupting your work.
Parcels
The central property record. Every inspection, complaint, permit, and document hangs off a parcel.
Four Record Types
Complaints, Periodic Inspections, Permit Applications, and Permits. Each with their own workflow and linked items.
Cross-Platform
Built on .NET MAUI — one codebase runs on Android, iOS, Windows, and macOS with identical functionality.
Offline-First
A local SQLite database, request queuing, and background sync keep the app running anywhere — even in the basement of a condemned building.
Getting Started
The first time you open Field Inspection, the app walks you through three quick steps: configuring the server, signing in, and loading your reference data. Once you're past these, the app drops you straight onto the calendar and you're ready to work.
Step 1 — Server Configuration (Setup Page)
First Launch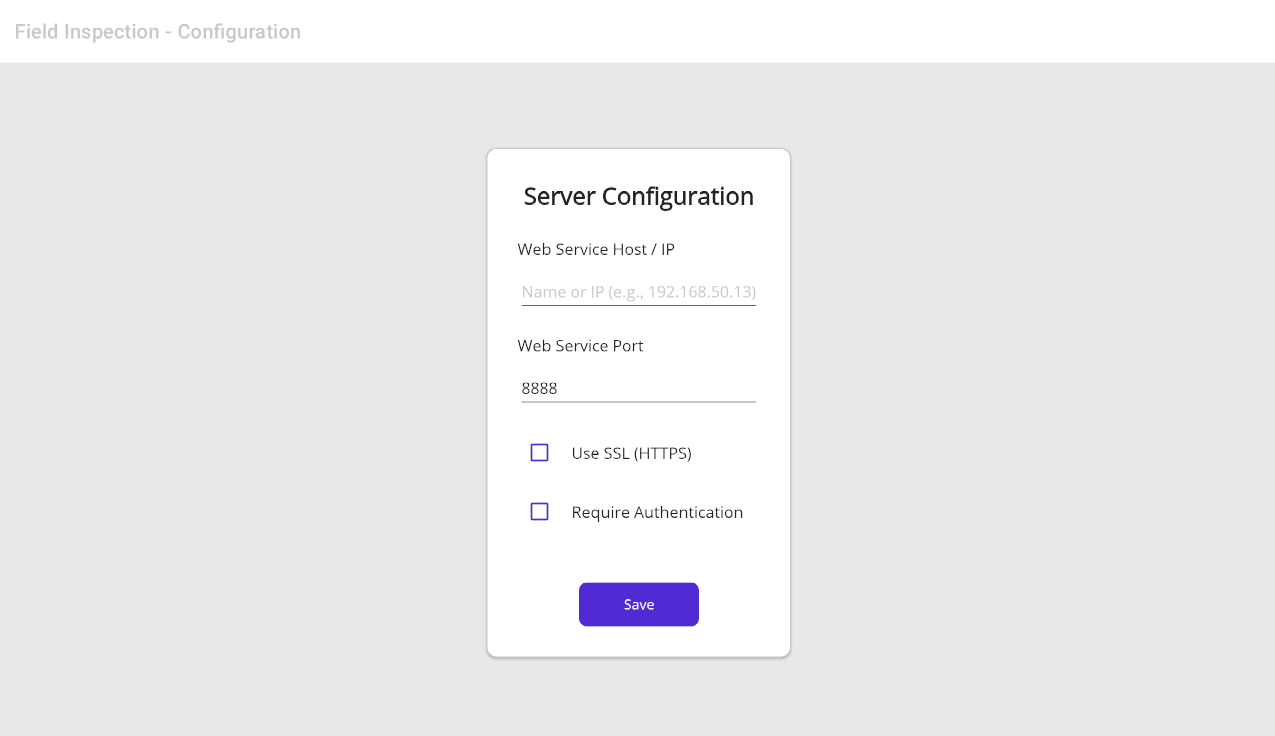
When the app can't find saved server settings, it shows the Server Configuration screen. This is where you point the app at your agency's Field Inspection server.
What you'll enter
- Web Service Host / IP — the hostname or IP address of the server (for example
192.168.50.13). - Web Service Port — the port number (defaults to
8888, or443if SSL is turned on). - Use SSL (HTTPS) — check this if your server uses a secure connection.
- Require Authentication — check this to force users to sign in. When it's checked, a Session Timeout dropdown appears (2, 4, 8, 12 hours, or Never).
Red warnings appear if the host is missing or the port is out of range. Tap Save and the app tests the connection — you'll see "Testing connection..." and then either a success confirmation or an error message with instructions on how to recover.
Step 2 — Sign In (Login Page)
AuthenticationOnce the server is configured, the Sign in to your account screen appears. Enter your credentials:
- Username — your account username (placeholder reads "Account username").
- Password — your password, hidden by default. Tap the Show / Hide toggle to reveal or mask it.
Both fields are required. If your credentials don't match or the server is unreachable, an error message appears in red and a loading spinner lets you know when authentication is in progress.
Buttons
- Sign In — submits your credentials.
- Close — clears the form fields (it doesn't close the app).
- Change Server Settings — a text link that takes you back to the Server Configuration screen. Visible to admins or when authentication is disabled.
Admin impersonation
If you type b********** as the username, an Impersonate User dropdown appears. This is a two-step admin flow — the first login uses the "User List" password to fetch the list of users, and a second login as your selected user completes the process. An info icon on the screen explains the details when tapped.
Re-Login (Session Expired)
InterruptionIf your session times out while you're working, a Session Expired dialog appears over the current screen with the same Username and Password fields. A dark overlay behind the dialog makes it clear that everything else is paused until you sign back in.
Unlike the regular login screen, the Re-Login dialog has no Close or Settings buttons — you must sign back in to return to your work. The back button is disabled here for the same reason. Once you successfully re-authenticate, the app drops you right back where you left off.
Step 3 — Loading the App
AutomaticAfter successful sign-in, the Loading Page takes over while the app gets itself ready. You'll see the Field Inspection logo, a blue activity spinner, and two status lines that update as each step completes:
| Status Message | What's Happening |
|---|---|
| Initializing database... | Preparing your local SQLite store. |
| Checking data... | Verifying that reference data is present. |
| Downloading reference data... | On first run only — pulls the list of inspectors, codebooks, and lookup values. |
| Loading calendar... | Building the month view for today's date. |
| Starting background services... | Bringing up the sync service and connectivity monitor. |
| Ready! | Off to the Calendar. |
If any step fails, a red error section appears with two buttons: Retry (run the step again) and Check Settings (go back to the Setup page). A typical error reads "Unable to connect to the server. Please check your internet connection and server settings."
Navigation & Sidebar
Field Inspection uses a thin icon sidebar that lives on the left edge of the app. It stays out of your way until you need it and gives you one-tap access to the main sections.
The Sidebar
Always Available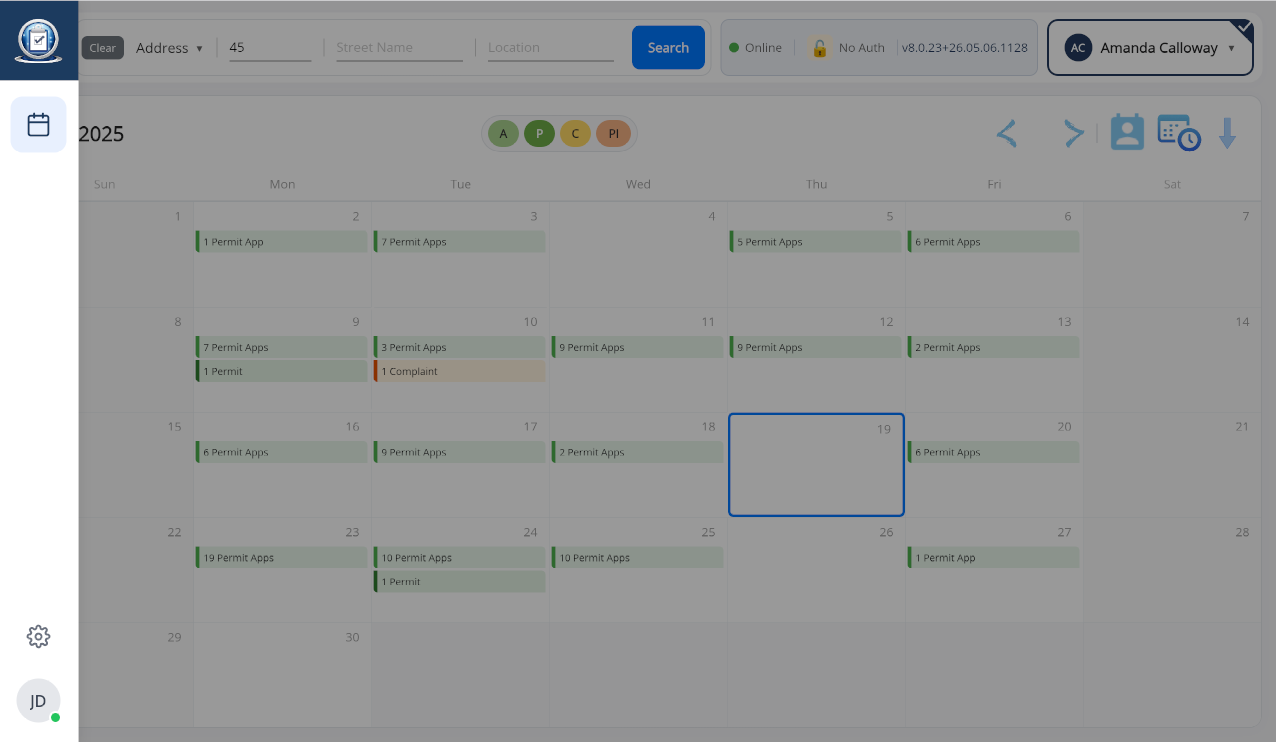
A thin 20-pixel transparent edge trigger runs down the left side of every screen. Tap or hover it and a small right-pointing chevron invites you to open the sidebar. Once open, the sidebar is 80 pixels wide and always visible until you collapse it.
What's in the sidebar
- Logo (top) — a dark blue Field Inspection logo box. Tap it to jump back to the home screen.
- Calendar — a calendar icon in a light blue background. Opens the main Calendar page.
- Bug / Debug — a bug icon that only appears when developer mode is enabled. Used for diagnostics.
- Settings — a gear icon at the bottom. Opens the Settings page.
- User avatar — shows your initials in a circular badge. A small green dot indicates you're signed in and connected.
All icons are clean dark gray SVGs with subtle hover effects. The sidebar carries a gentle shadow to separate it visually from the main content.
The Calendar Page
The Calendar is your home base. Every scheduled complaint, periodic inspection, permit, and permit application shows up here on the day it's due. Tap a day to see the cards for that day, tap a card to drill into the parcel, or use the search bar up top to jump directly to any property.
The Main Calendar View
Home Screen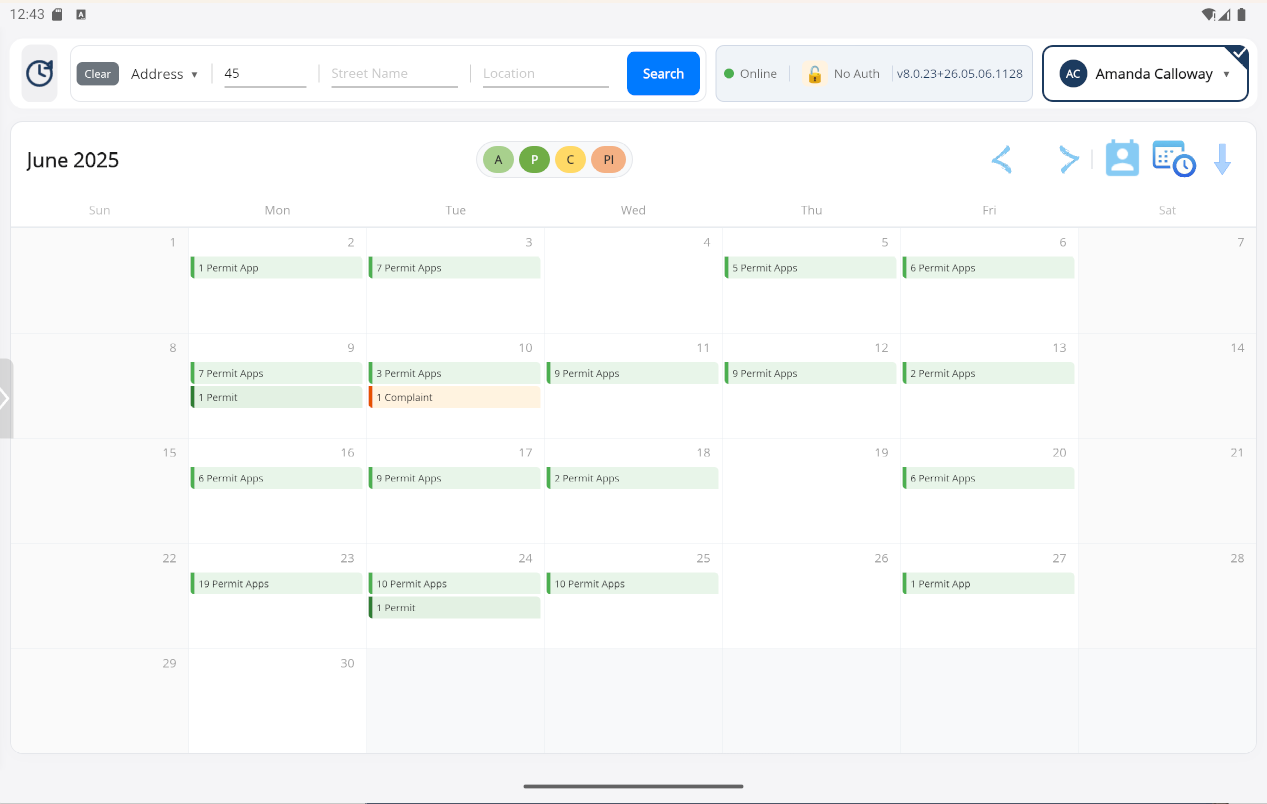
The calendar displays the current month in a 7-column grid (Sunday through Saturday), showing 5 or 6 rows depending on the month. Each day cell shows the day number and colored badges for any inspections scheduled that day.
The toolbar (top)
- Recent Parcels (left) — a history icon with a blue badge showing how many recently accessed parcels are available. Tap it to open the Recent Parcels panel.
- Search bar (center) — pick a search type from the dropdown (Address, Owner Name, Business Name, SBL, or Record Number) and type your query.
- Inspector picker (right) — the dropdown labeled "Inspector" filters the calendar to show only one inspector's workload.
- Sync button — a lottie-animated download icon tooltipped "Check for new complaints and inspections". Only visible while you're online.
The filter pills
Above the grid you'll see the month/year title (e.g. April 2026) and four colored filter pills. Tap any pill to hide or show that record type on the calendar:
A — Permit Applications P — Permits C — Complaints PI — Periodic Inspections
Moving between months
- < — previous month (animated).
- > — next month (animated).
- Calendar picker icon — opens a date picker that lets you jump to any month within ±2 years.
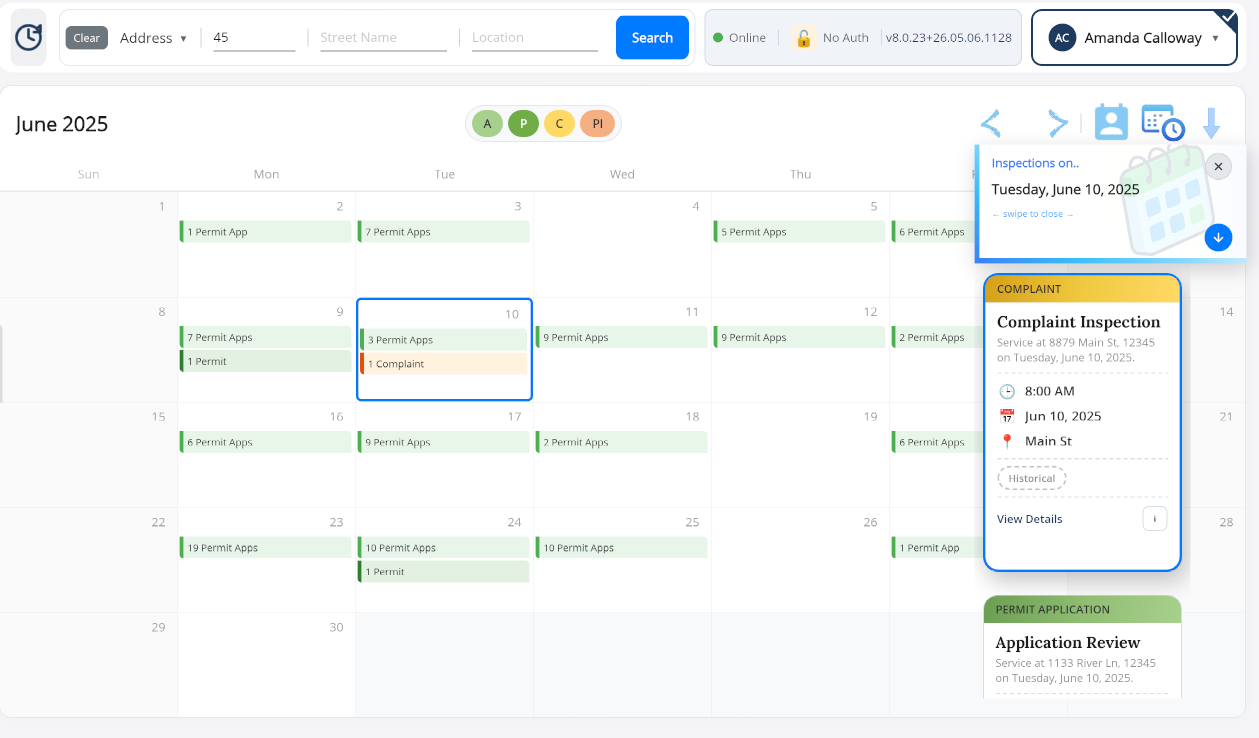
Day View — Overlay Inspection Cards
Tap a Day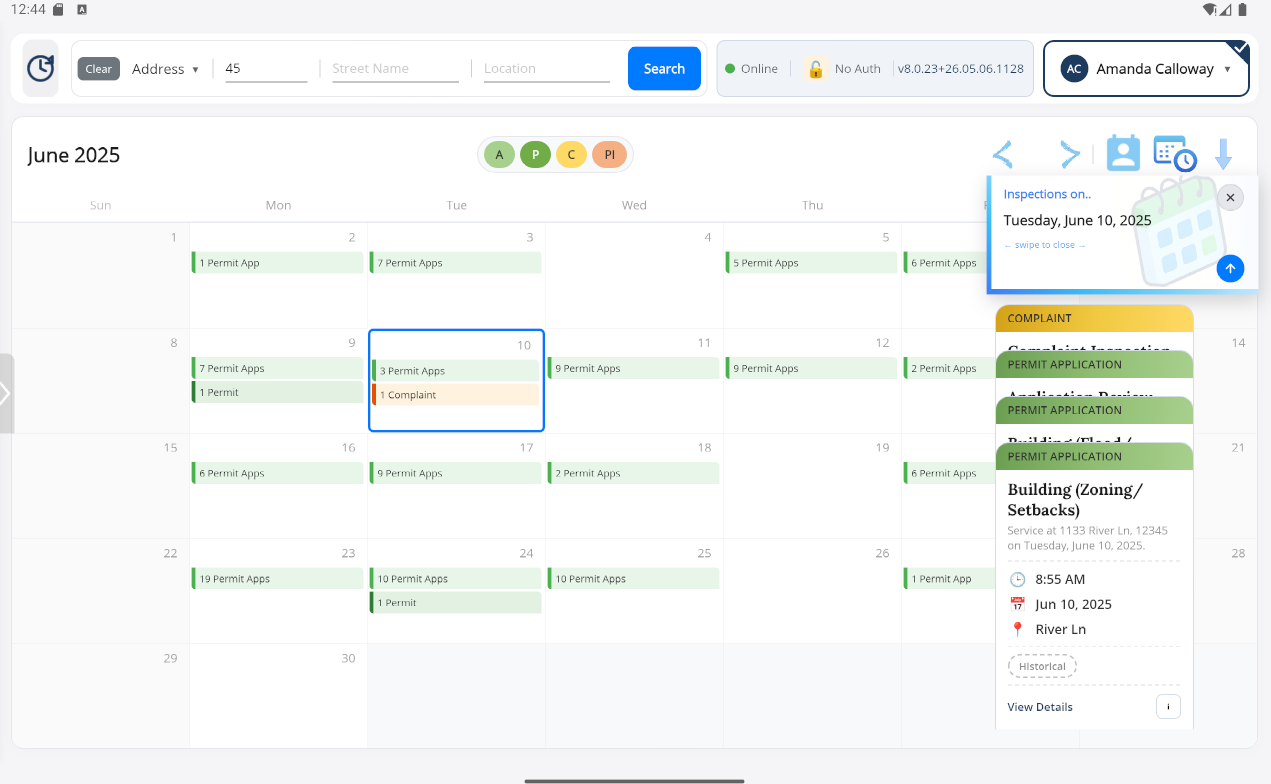
When you tap a day on the calendar, a sliding panel opens on the right side showing every inspection scheduled for that date. Each inspection appears as a card with all the key details you need at a glance.
The overlay header
- Title in the form "Inspections on.. Wednesday, April 8, 2026" with a blue gradient accent.
- A hint reading "← swipe to close →" letting you know you can dismiss by swiping.
- A close button (X) in the top-right corner.
- A blue collapse button in the bottom-right that minimizes the cards into a peek mode.
What each card shows
- A colored record type header (e.g., PERMIT, COMPLAINT, PERMIT APPLICATION).
- The inspection type name (bold, up to 2 lines) and a short description.
- Time, date, and street address with icons.
- A "Historical" badge on past records.
- An action line in dark blue such as "View Details" or "Inspection Due", with a small ⓘ info button.
Tapping a card
- One card on a day — tapping jumps straight to the Parcel Detail page.
- Multiple cards — the first tap expands the stack; tap a card again to select it and once more to open it.
- While navigating, a semi-transparent overlay with "Loading parcel..." appears on the tapped card.
- The ⓘ button opens a quick-view popover with ID, address, date, time, inspector, valuation, parcel IDs, and contacts — no navigation required.
Parcel Search
Find Anything Fast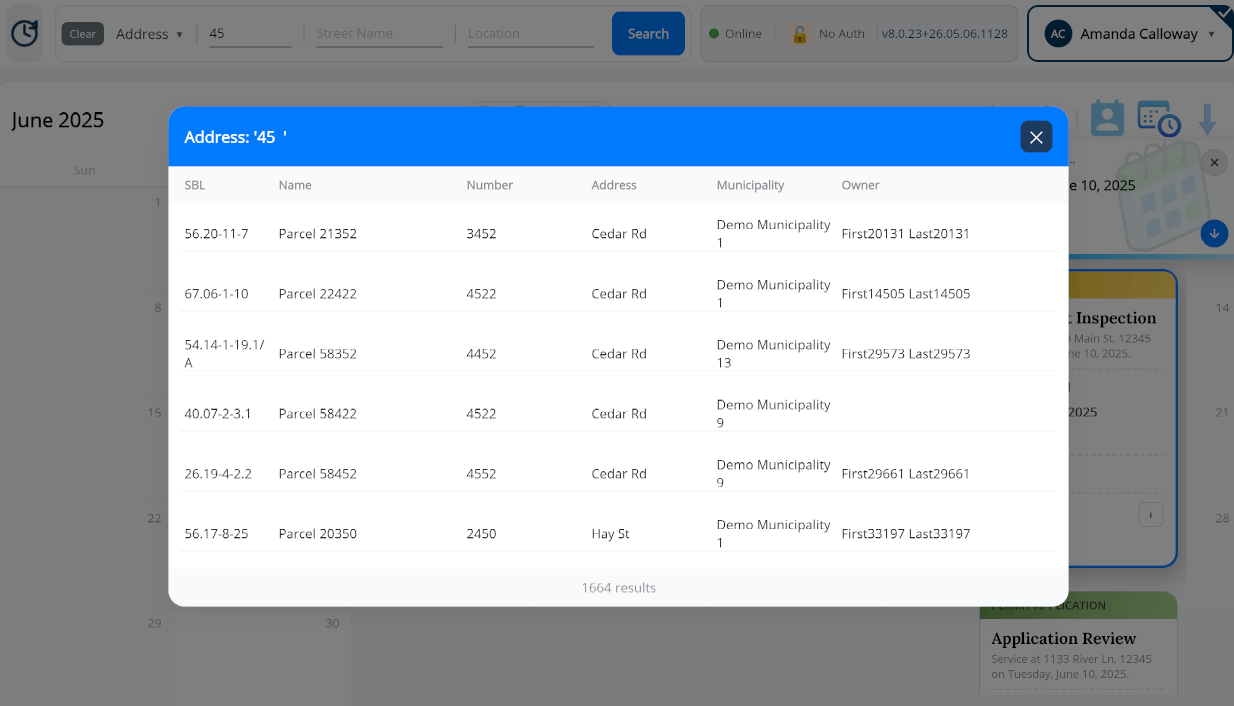
The search bar at the top of the Calendar lets you find any parcel in the system by a number of different criteria. The input fields change depending on the search type you've selected:
- Address — three fields: Street, City, ZIP.
- SBL — two fields.
- Owner name / Business name / Record number — a single field.
Results open in a centered modal with a blue header listing the columns: SBL, Name, Number, Address, Municipality, and Owner. Selected rows highlight in light blue, and a spinner appears briefly while the app loads the parcel you've chosen. The footer shows the total count (e.g. "42 results"). If nothing matches, you see a magnifying glass icon and the message "No parcels found".
Inspector Selector
Filter by InspectorIn the top-right corner of the Calendar sits the Inspector Selector — a white box with a dark blue avatar circle (showing the current inspector's initials), the inspector's name, and a dropdown chevron.
Tap it to open a modal list of every available inspector. A blue checkmark badge sits on the currently selected one. Pick a different inspector and the calendar immediately refreshes to show only their workload. If no one is selected yet, the avatar shows a ? and the placeholder reads "Select Inspector".
Recent Parcels
Quick Access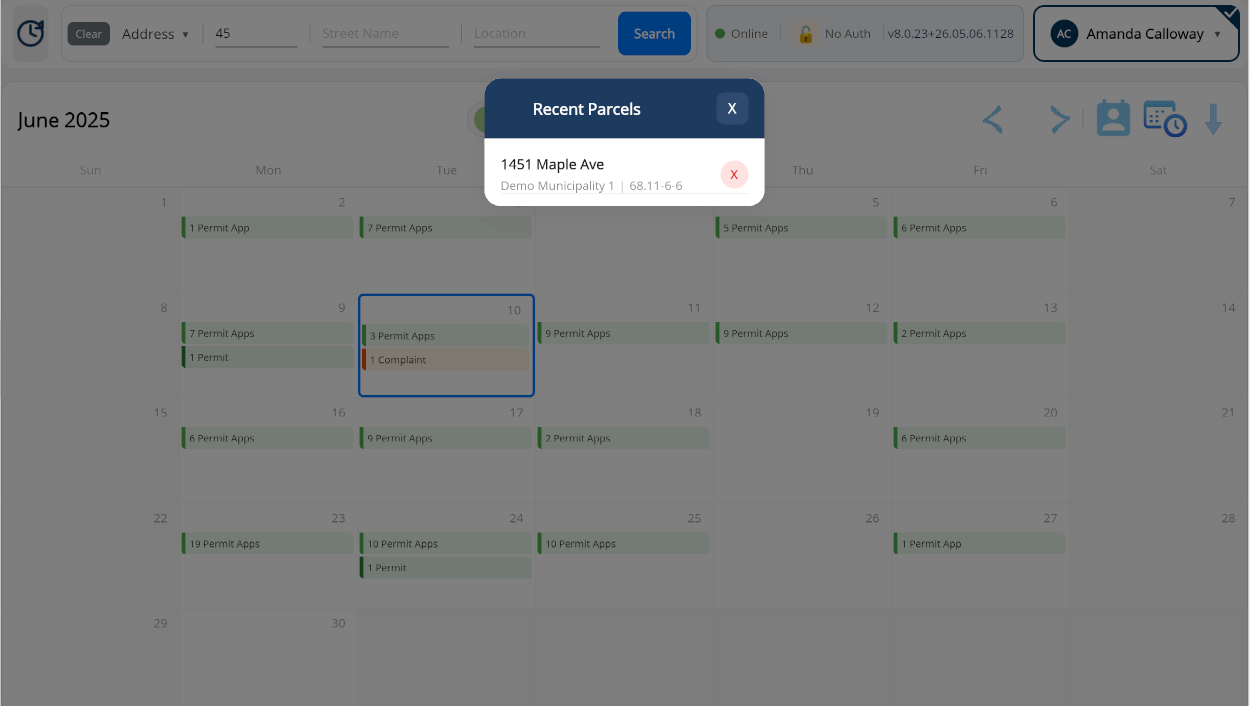
Tapping the history icon on the left side of the Calendar toolbar opens the Recent Parcels popup. It lists the parcels you've recently accessed so you can jump back to any of them in a single tap — a real time-saver when you're bouncing between properties on the same block.
When you haven't opened any parcels yet, the popup shows a clock icon with the empty-state message "No recent parcels — Parcels you access will appear here". An X button in the top-right closes the popup.
Syncing & Refreshing Data
Stay Current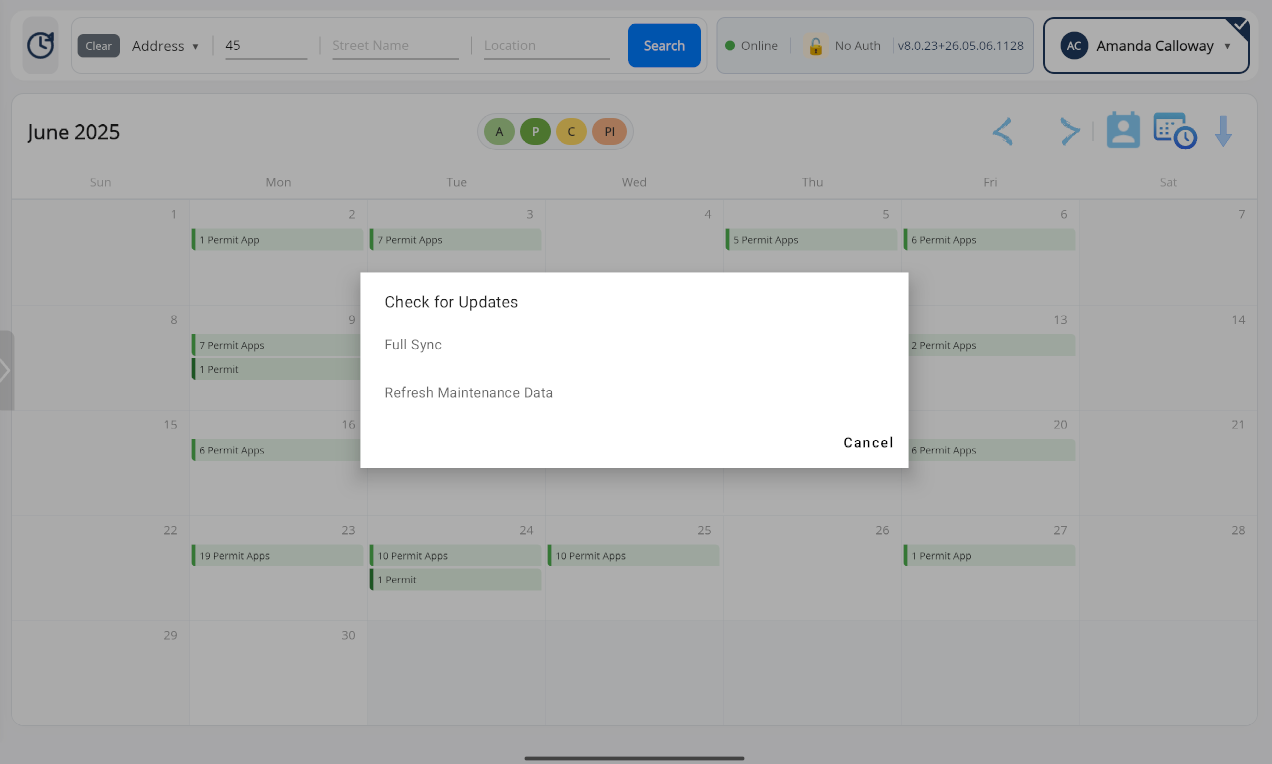
The sync / download icon on the right side of the Calendar toolbar opens the Check for Updates dialog. Use this any time you want to pull the latest data from the server without waiting for the next automatic sync cycle. You'll see two options:
- Full Sync — pushes any pending local changes and pulls down every complaint, permit, and inspection update from the server.
- Refresh Maintenance Data — re-downloads reference data (inspectors, codebooks, departments, lookup lists) without touching inspection records.
A Cancel button at the bottom right dismisses the dialog without doing anything.
The Parcel Detail Page
When you open a parcel — either by tapping a calendar card or selecting a search result — you land on the Parcel Detail page. This is where the bulk of your inspection work happens. It's a sliding three-panel layout that shows the parcel's static info on the left, its records in the middle, and whichever record you're currently editing on the right.
Overall Layout
Three Sliding Panels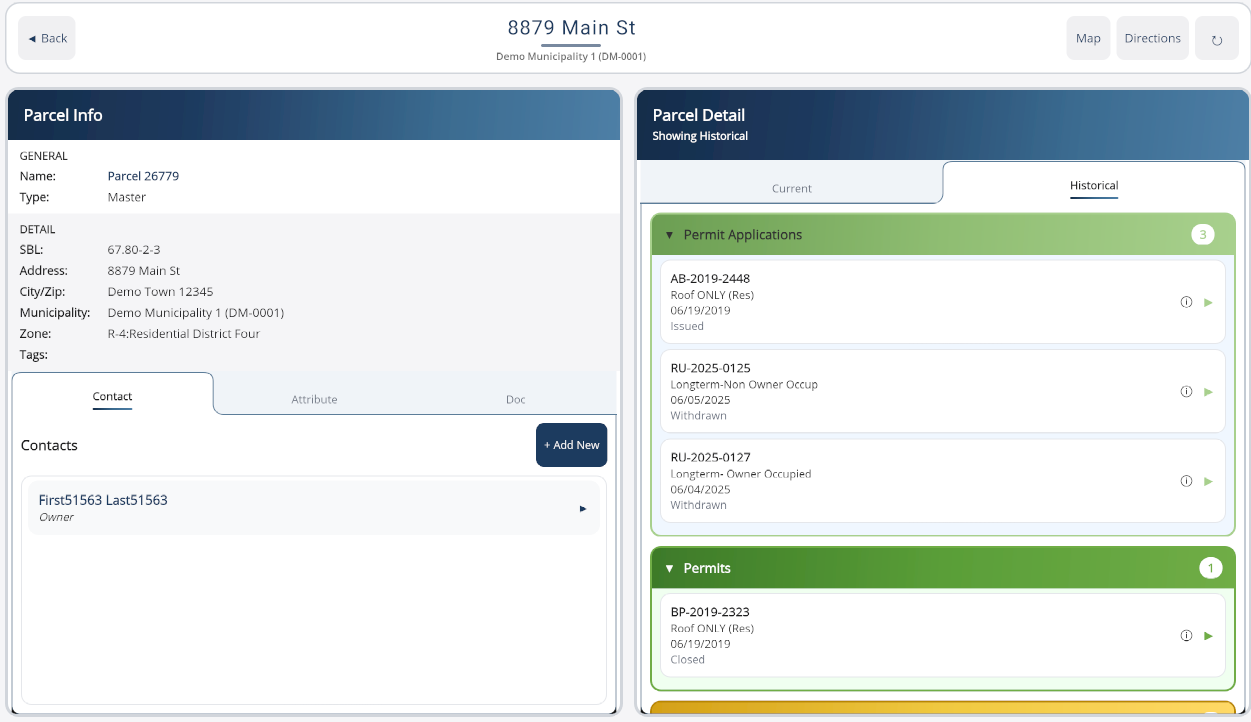
Three panels you can swipe between
- Panel 1 — Parcel Info (left). All the static information about the property: name, type, SBL, address, municipality, zone, tags — plus tabs for Contacts, Attributes, and Documents.
- Panel 2 — Parcel Records (middle). Current and Historical tabs, each listing every Permit Application, Permit, Complaint, and Periodic Inspection attached to this parcel.
- Panel 3 — Record Detail (right). Whichever individual record you've opened for editing. This panel is created on demand — it only appears once you pick something to work on.
To move between panels you simply swipe horizontally. The app uses velocity-based snapping, so a quick flick moves you to the next panel even if you didn't drag all the way. Edge resistance keeps you from overshooting the first or last panel.
The top toolbar
- Back — returns to the previous screen. Does not save edits in sub-panels.
- Address & municipality — shown in the center, large bold text with a blue underline accent.
- Map — opens the parcel location in Google Maps.
- Directions — launches turn-by-turn navigation to the parcel.
- Refresh (↻) — manually re-pulls parcel data from the server. Disabled while refreshing.
Panel 1 — Parcel Info
Left SideThe Parcel Info panel is where you see at-a-glance details about the property itself. At the top, two read-only sections display the key identifiers:
- GENERAL — Name (bold) and Type.
- DETAIL — SBL, Address, City/Zip, Municipality, Zone, and Tags.
Below that, three tabs let you switch between Contact, Attribute, and Doc. The Contact tab is selected by default. A gradient blue underline shows which tab is active.
Attributes Tab
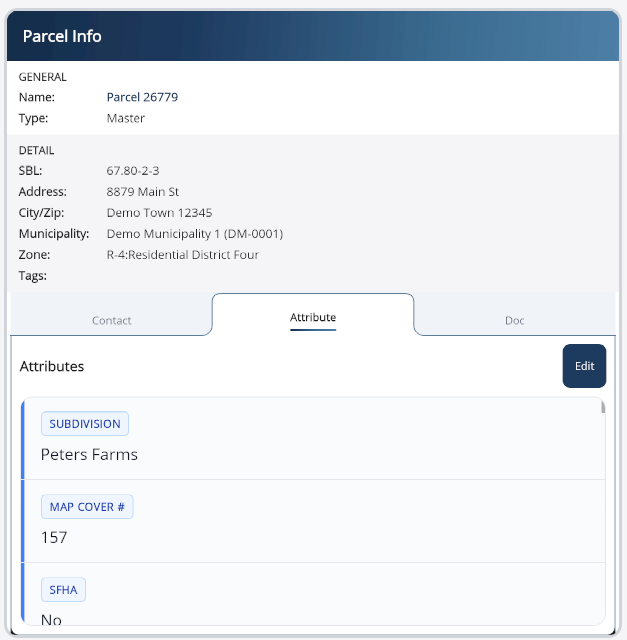
Each attribute appears as a card with:
- A blue uppercase badge showing the attribute name.
- The attribute value prominently displayed below.
- A blue left accent bar and a gray separator between items.
Attributes are read-only by default. If editing is allowed for the current parcel, an Edit button appears in the header. A "Saving..." status and spinner show while changes are being persisted.
Contacts Tab
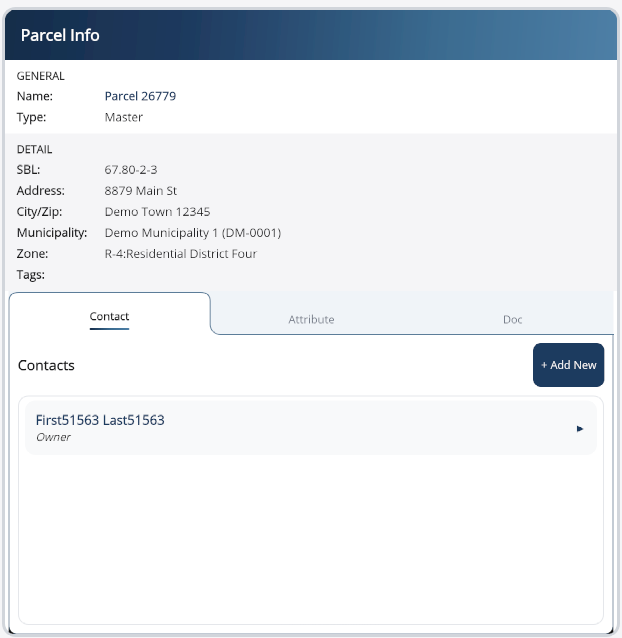
Contacts are listed as selectable boxes. Each shows the contact's name (bold) and type (italic — Owner, Tenant, Manager, etc.) with a small arrow on the right. Tap a contact to select it — a brief spinner confirms loading:
A + Add New button at the top-right opens the Add Contact flow (covered in the Sub-Entries section further down).
Documents Tab
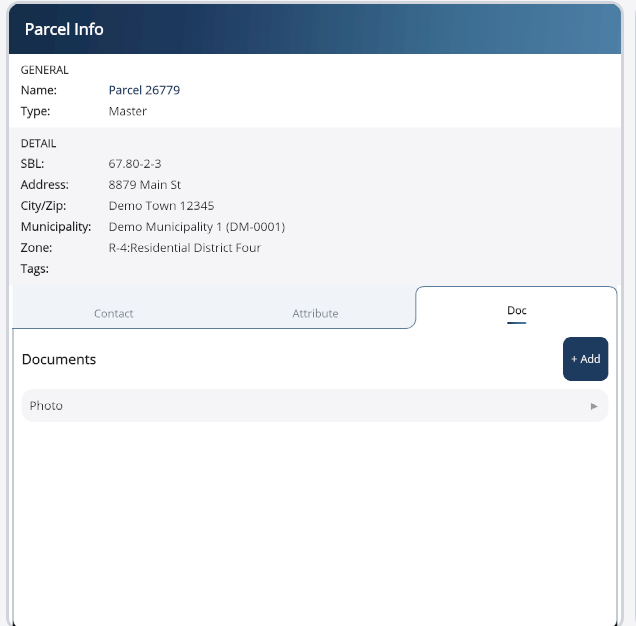
Documents are listed as clickable boxes with the file name and a > indicator. A + Add button at the top-right lets you attach new files. Tapping a document downloads it if it's not already cached (with a progress overlay) and then opens it in the default app for that file type. Subsequent taps open the cached copy immediately.
If no contacts, attributes, or documents exist for a parcel, the tab shows a centered "No [type]" message in italic gray.
Panel 2 — Parcel Records
Current & Historical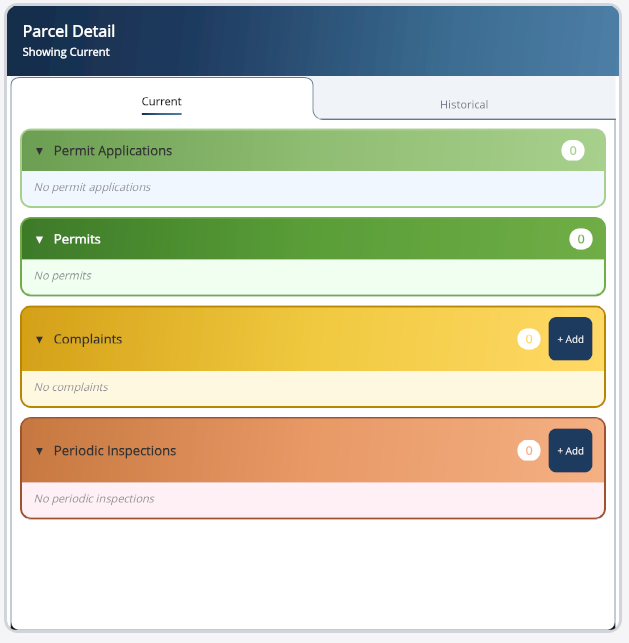
The middle panel organizes every record attached to the parcel into four collapsible sections:
Permit Applications Permits Complaints Periodic Inspections
Each section has its own colored header, a count badge, and an expand/collapse chevron. The Complaints section also has a + Add button for creating a new complaint on the fly. Tapping a record selects it and loads its detail panel to the right.
Current vs Historical
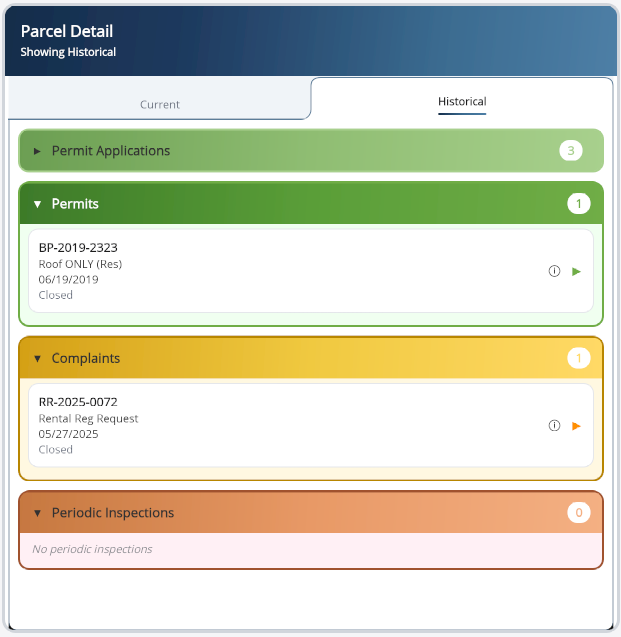
Two folder-style tabs at the top of the panel switch between Current (the most recent/active records) and Historical (older, closed-out records). Both tabs share the same layout so you can compare a parcel's current state against its past. Historical records are typically read-only for reference.
Paging through long lists
If a section contains more records than fit on one page, pagination controls appear below the list — ◀ Previous and Next ▶ buttons with the current "Page X of Y" shown in the middle. Buttons are automatically disabled when you reach the first or last page.
The Four Record Types
When you tap a record from the middle panel, its Detail Panel slides in from the right. There are four different detail panels — one for each record type — and they all share the same overall pattern: a header with Save/Print buttons, a set of core fields at the top, and tabbed sub-sections (Contact, Violation, Action, Doc, and so on) at the bottom.
Complaint Panel
Record Type: C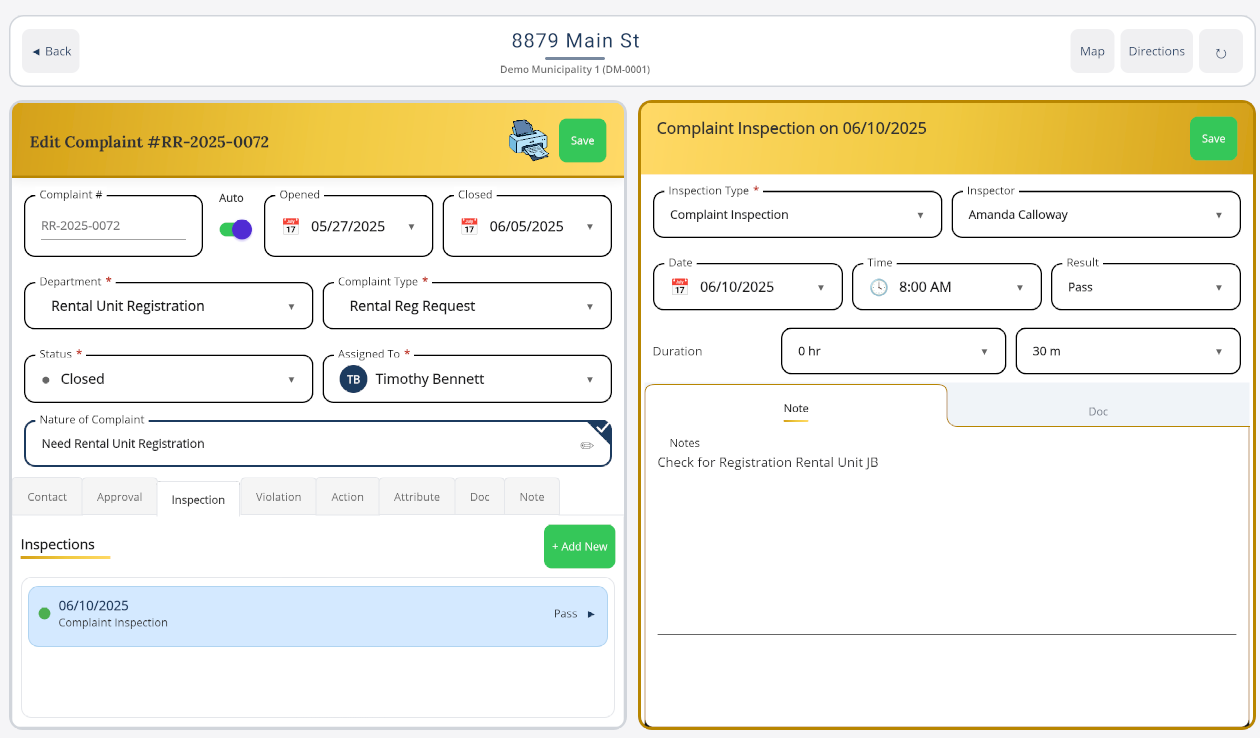
Used to document and track property-related complaints from the time they come in until closure. This is the core workflow for code enforcement and citizen complaint management. From within a complaint you can add inspections, violations, and follow-up actions without ever leaving the panel.
Core fields
- Complaint # — auto-generated by default; a toggle lets you enter one manually.
- Opened and Closed dates.
- Department — required dropdown.
- Complaint Type — required dropdown.
- Status — required.
- Assigned To — required inspector selector.
- Nature of Complaint — free-text field with a pencil icon that opens a larger edit modal.
Tabbed sub-sections
Below the core fields, these tabs let you work on everything linked to the complaint:
Contact Approval Inspection Violation Action Attribute Doc Note
Saving
A green Save button sits in the header. A Print Form button lets you generate a PDF of the complaint. The Save button is only enabled when all required fields are valid.
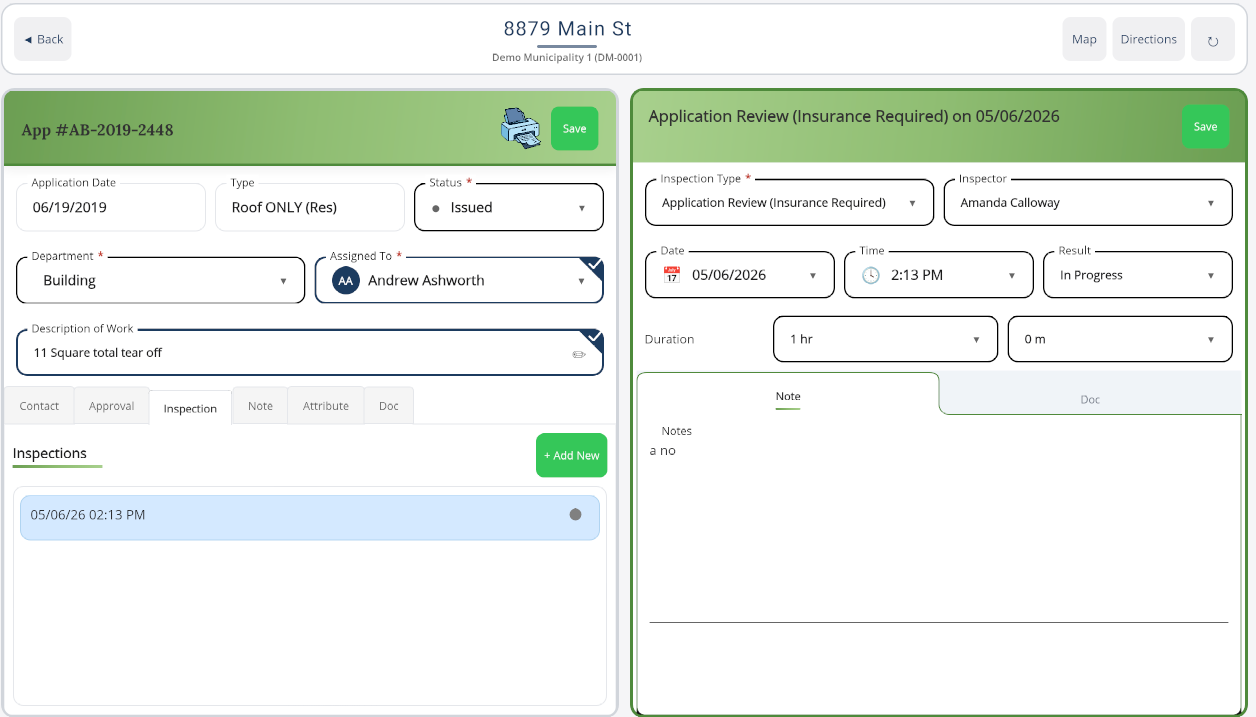
Periodic Inspection Panel
Record Type: PIUsed to record scheduled, routine inspections of a property. Inspectors use this to work through digital checklists, document what they found, and log violations or corrective actions.
Core fields
- Inspection Type — required dropdown.
- Inspector — required. This field is disabled until you've picked an Inspection Type.
- Date and Time of the inspection.
- Result — status picker (Pass, Fail, Conditional, etc.).
- Duration — separate Hours and Minutes pickers for how long the inspection took.
Tabbed sub-sections
Contact Checklist Violation Action Attribute Doc
The Checklist tab is unique to Periodic Inspections — that's where you'll work through each individual inspection item and mark its status.
Saving & rescheduling
In addition to the standard green Save button, a blue Reschedule button appears in the header when the current inspection is eligible to be moved to another day (with an info icon explaining the conditions). Save and Reschedule are mutually exclusive based on the state of the form.
Permit Application Panel
Record Type: A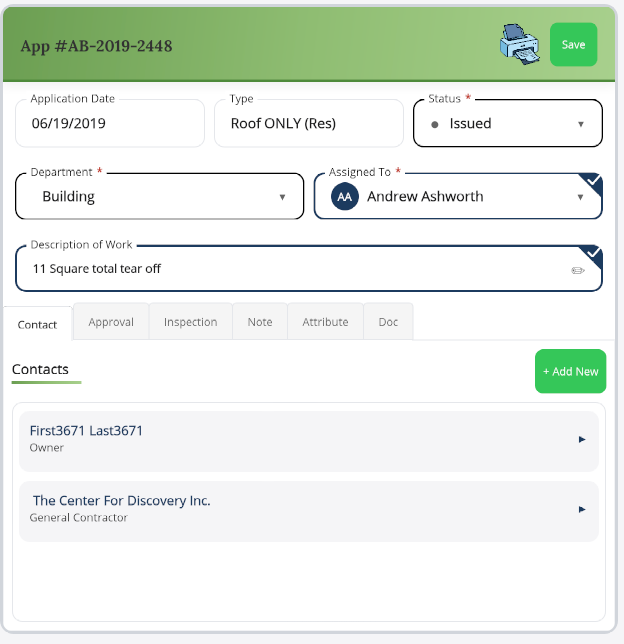
Used to capture new permit applications before they are approved. Applicants (or staff on behalf of them) propose work, the application is routed through approval groups, and once approved it becomes a Permit.
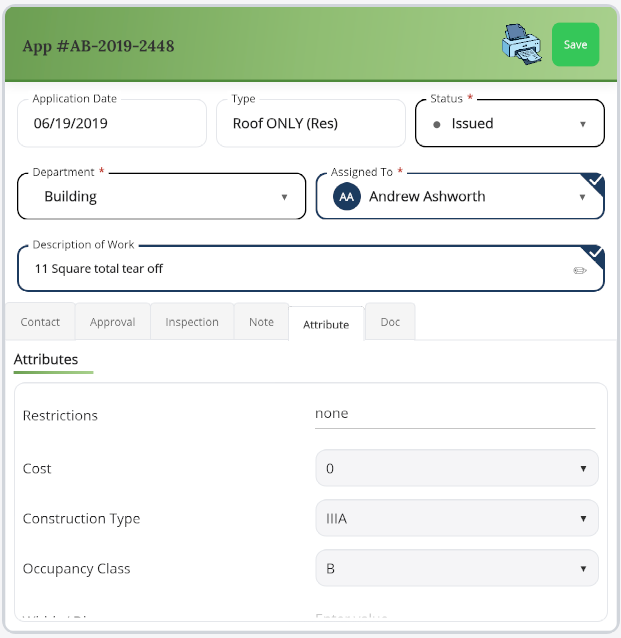
The Attribute tab contains custom fields specific to the permit type — for example, restrictions, work start dates, or any other data points your agency has configured for that application category.
Core fields
- Application Date — read-only for existing records; set automatically for new ones.
- Type — read-only once set.
- Status — required (Pending, Under Review, Approved, Rejected, etc.).
- Department — required.
- Assigned To — required inspector selector.
- Description of Work — full-width text editor. Tap the border to open the expanded editor. A completion badge appears when the field is filled in.
Tabbed sub-sections
Contact Approval Inspection Note Attribute Doc
The Approval tab shows a read-only list of decisions from review groups — the group name, the status date, and whether the group has approved or rejected.
Permit Panel
Record Type: P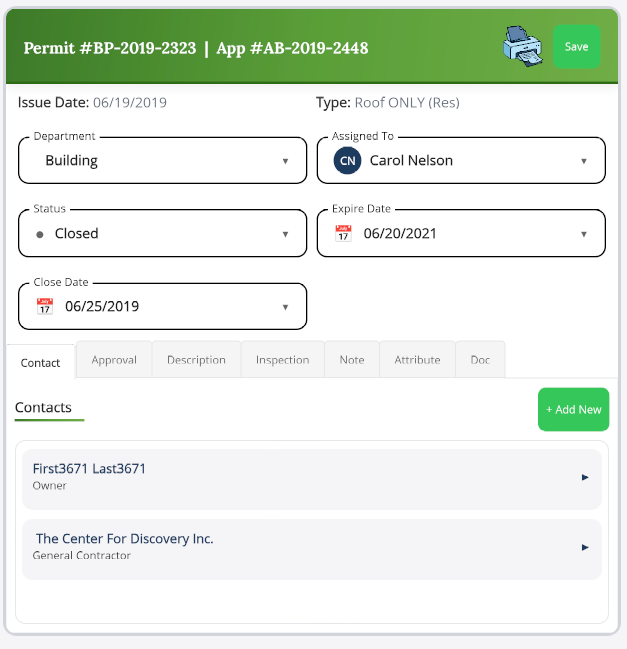
Used for tracking issued permits through their lifecycle — active, completed, and eventually closed. Unlike applications, permits represent approved work that's been granted.
The Inspection tab lists every inspection linked to the permit, each row showing the date/time, inspection type, and a colored Pass/Fail indicator. Tap a row to open that inspection, or use + Add New to record a fresh inspection against the permit.
Core fields
- Issue Date — read-only.
- Permit Type — read-only.
- Department, Assigned To, and Status — all editable.
- Expire Date — date picker for the permit's expiration.
Conditional fields
The Status dropdown controls which extra fields are visible:
- When Status is Completed: Completion Date and Completion Type appear.
- When Status is Closed: Close Date appears.
Tabbed sub-sections
Contact Approval Description Inspection Note Attribute Doc
The Permit's Approval tab inherits (read-only) the approval decisions from its parent Permit Application.
Printing Forms
PDF Output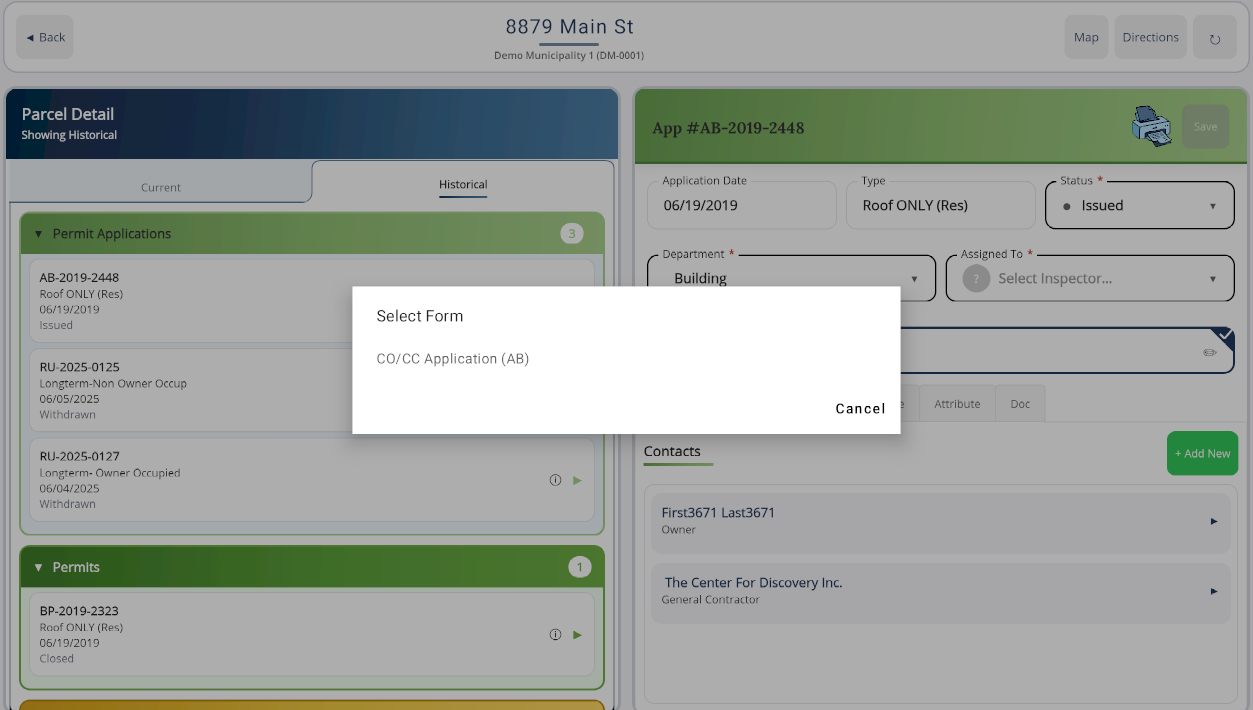
When you tap the Print Form (printer) icon in the header of a Permit Application, Permit, Complaint, or Periodic Inspection, the Select Form dialog appears. It lists every print template your agency has configured for that record type — for example:
- C0101 Application (UB)
- Fire Breakdown
- Routine Routing Sheet
Pick a template and the app generates a PDF that you can preview, share, email, or save locally. A Cancel button at the bottom closes the dialog without generating anything.
Sub-Entry Pages
Within a record you'll often need to create smaller linked items — a new contact, a violation you just observed, an enforcement action, or a checklist finding. The app opens these as focused sub-entry pages so you can fill in just what's relevant without losing your place in the parent record.
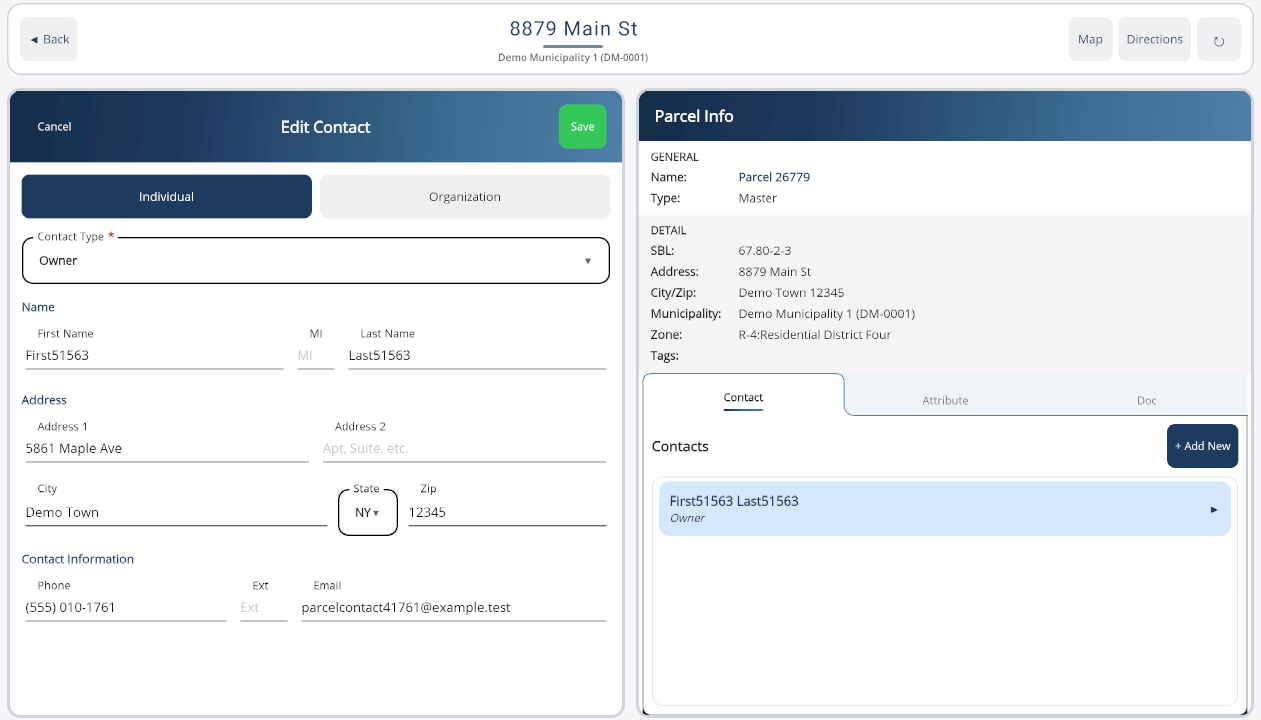
Add Contact (Quick Modal)
PopupA centered modal dialog that appears over the current screen when you want to quickly add a contact. Two toggle buttons at the top switch between Individual and Organization modes.
Fields
- Contact Type (required dropdown)
- Name — First / MI / Last (Individual) or a single Name field (Organization)
- Address — Address 1, Address 2, City, State, ZIP
- Phone with extension, Email
Buttons
Clear, Cancel, and the green Save button. Validation errors appear in red above the buttons.
Add Record Contact (Full Page)
Dedicated PageA full-screen version of the Add Contact form with the same fields laid out for larger screens and stricter validation (Address 1, City, State, and Contact Type are all required). Toggle between Individual and Organization at the top; Save and Cancel live at the bottom.
Add Action Page
Enforcement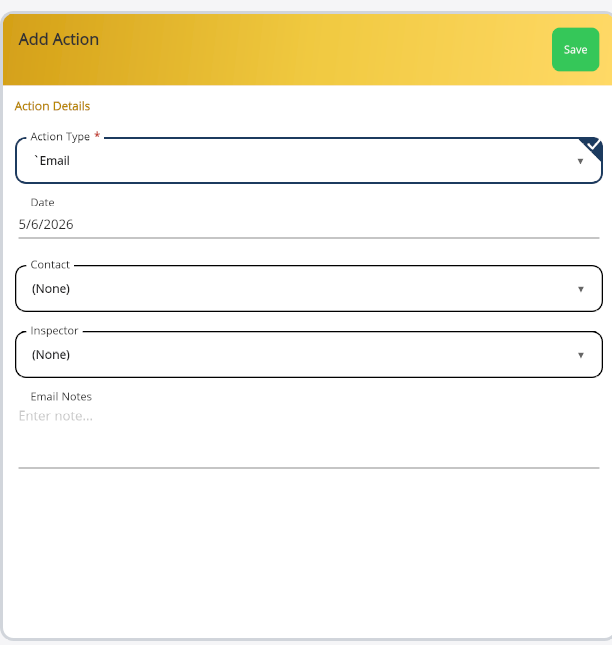
Opens when you need to log a follow-up action tied to an inspection or a checklist condition — things like citations issued, corrective notices mailed, or follow-up inspections scheduled.
Fields
- Action Type — required dropdown.
- Date — date picker.
- Contact — picker (shown when applicable).
- Inspector — picker (shown when applicable).
Two note tabs at the top each provide a text editor for detailed notes with configurable labels. The Save button is only enabled after Action Type is chosen, and a loading overlay appears while the save is in progress.
Add Violation Page
Code ViolationWhere you document a specific code violation found during an inspection.
Fields
- Issued On — when the violation was documented.
- Comply By — deadline for correction.
- Status (required) and Status Date.
- Issued To — contact picker.
- Area Involved — short text describing the affected area.
- Article — multi-line text for the code or regulation reference.
- Corrective Action — multi-line description of what needs to be fixed.
- Notes — additional free-text notes.
Violation Code (required)
A special Select Code button opens a hierarchical codebook picker. The selected code is then displayed in a bordered field. Both Status and Violation Code must be filled in for Save to enable.
Checklist Item Detail Page
Periodic InspectionOpened when you tap into a specific checklist condition on a Periodic Inspection. It's a view-and-manage page rather than an edit form — its purpose is to let you see everything tied to that condition and add new violations or actions as needed.
What's on the page
- Condition Name in the header.
- A status indicator button that cycles through the possible statuses (with color coding) when tapped.
- Two tabs: Violations and Actions.
Violations tab
Lists every violation already linked to this condition. Each shows its codebook name, issued date, and area involved. Tap a violation to edit it, or use Add Violation to add a new one (pre-linked to the current condition). Empty state: "No violations linked to this checklist item".
Actions tab
Same pattern — each row shows the action name, date, and inspector. Add Action creates a new action pre-linked to the condition. Empty state: "No actions linked to this checklist item".
Settings
The Settings page is your control panel for the app. You'll find five sections covering display preferences, server connection, backups, advanced offline/sync options, and a destructive App Reset action that should only be used when you really mean it.
Display Settings
Text Size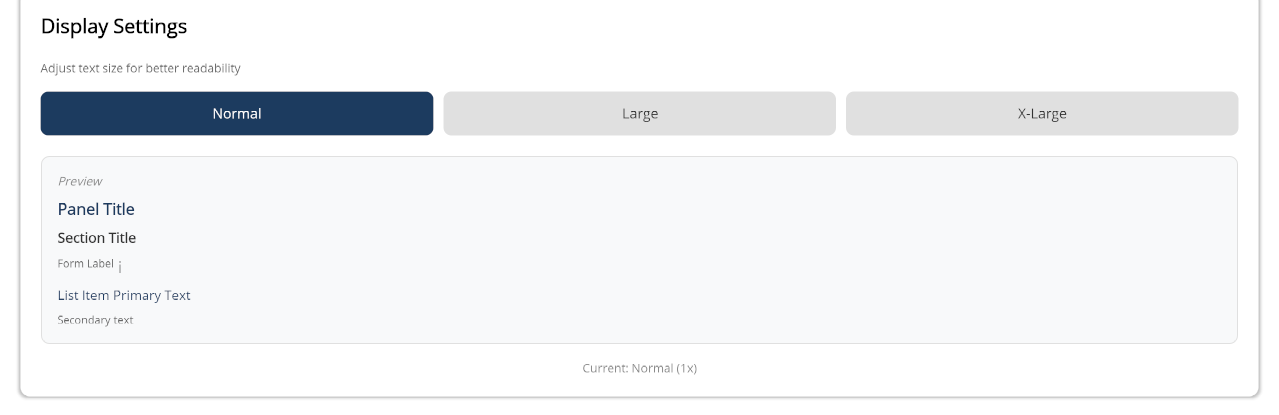
Adjusts the text size across the entire app for readability. You have three options:
- Normal (1.0x) — the default.
- Large (1.25x) — 25% larger text.
- X-Large (1.5x) — 50% larger text.
A preview panel shows how panel titles, section headings, form labels, and list items look at your selected scale. The selected button highlights in dark blue. A status label below confirms your choice (e.g. "Current: Normal (1.0x)").
Server Configuration
Connection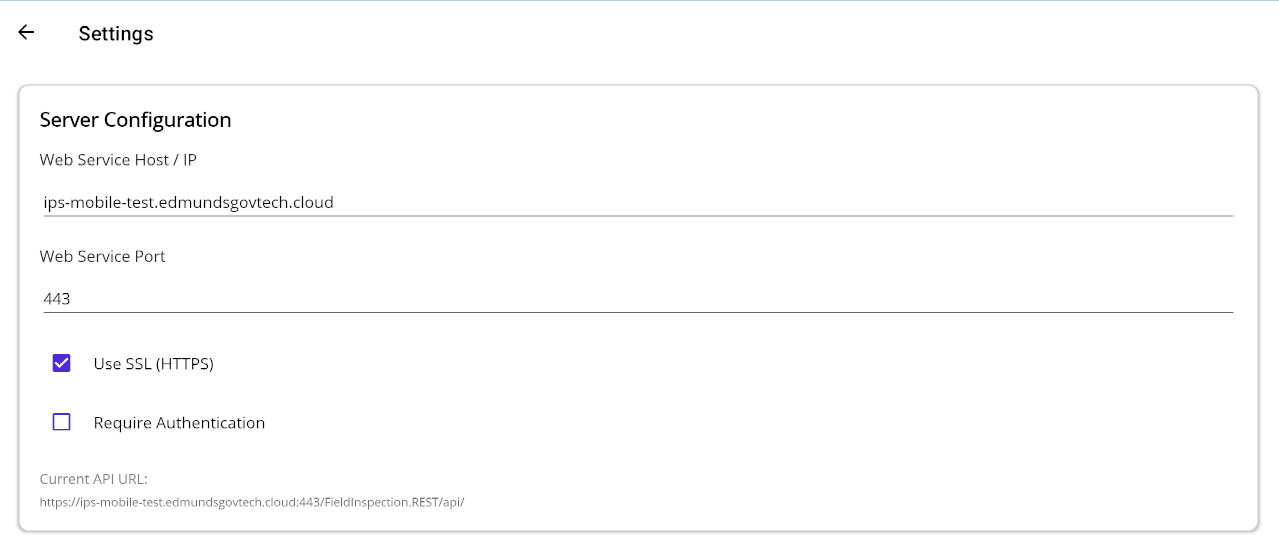
The same fields as the first-launch Setup page, now available for editing whenever you need to move to a different server or change auth settings:
- Web Service Host / IP — required.
- Web Service Port — accepts 1-65535.
- Use SSL (HTTPS) — switches default port to 443 when enabled.
- Require Authentication — reveals the Session Timeout dropdown (2h, 4h, 8h, 12h, or Never).
A Current API URL preview shows how your inputs translate to the actual server URL, e.g. https://192.168.50.13:443/FieldInspection.REST/api/.
Buttons
- Save & Test — validates, saves, and tests the connection. Shows a green success message or an orange warning if the settings were saved but the connection failed.
- Reset — discards unsaved changes and reloads the current values.
Database Backup
Data Protection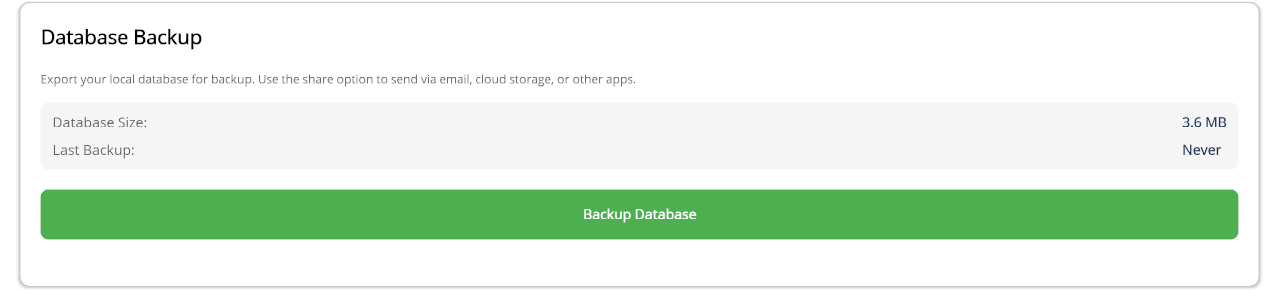
Exports your local database for safekeeping.
- Database Size — the current size of your local database in B, KB, MB, or GB.
- Last Backup — date and time of your most recent backup, or "Never".
- Backup Database button — creates the backup file and opens your device's share menu so you can email it, upload to cloud storage, or save it locally.
The status label below the button updates as the backup progresses: "Creating backup...", then a size confirmation, then a final success or error message.
Advanced Options
Power Users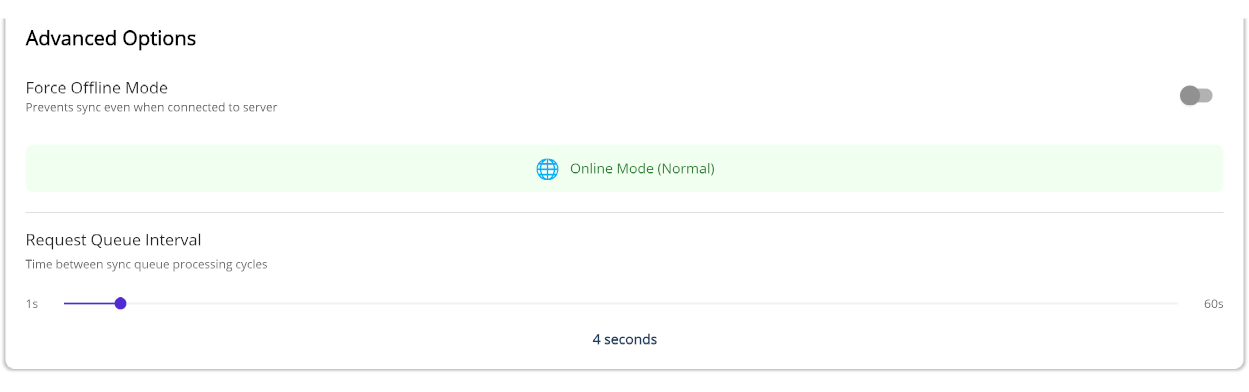
- Force Offline Mode — a toggle that prevents the app from syncing even when you have a connection. When on, the indicator below turns orange with a plane icon and shows "Forced Offline Mode". When off, it's green with a globe icon reading "Online Mode (Normal)".
- Request Queue Interval — a slider from 1 to 60 seconds (default: 4) that controls how often the app processes pending sync operations.
Developer-only options
Hidden by default. To unlock them, tap the Session Timeout label five times. Once enabled you'll see:
- Debug Parcel Cache — count of cached parcel search results with sample entries.
- Attachment Path Migration — updates file paths in the attachments table. Enter a base directory (default
C:\ProgramData\Tablet) and tap Migrate Attachment Paths. A confirmation dialog appears before migration runs.
App Reset
DESTRUCTIVE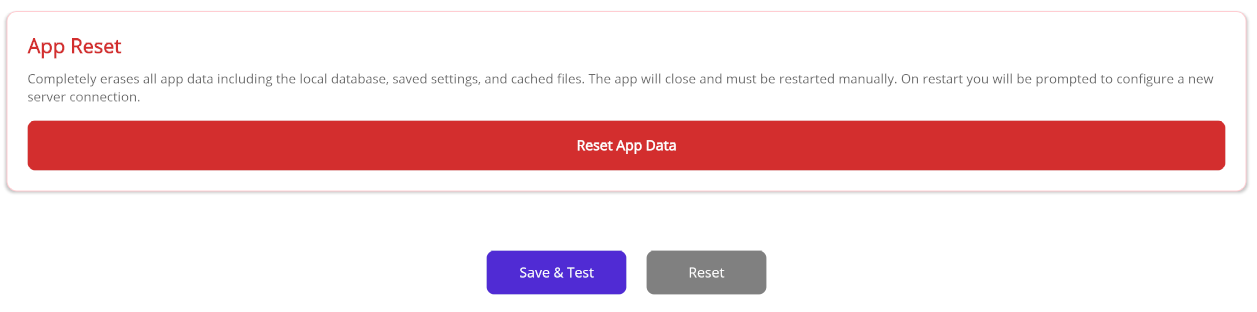
Tapping the red Reset App Data button kicks off a two-step confirmation:
- First prompt: "This will permanently delete all local data... Are you sure you want to continue?" with Yes, Continue and Cancel.
- Second prompt: "Type CONFIRM to proceed with the reset:" with a text input. You must type exactly
CONFIRMfor the reset to run.
On success: "All app data has been erased. The app will now close. Please reopen it to set up a new connection." and the app closes. If the typed text doesn't match, nothing happens and a message tells you so.
Workflows & Reference
The previous sections describe screens individually. This one stitches them together — what to do on Day 1, how a periodic inspection actually flows, what happens when you lose connectivity, and what to expect when something goes wrong.
Day 1 — A First-Time Walkthrough
For New InspectorsIf you've just been issued a tablet, follow these steps in order. Most of them only have to happen once.
- Confirm the server is configured. If your IT team set the device up, this is already done. If not, the Setup page appears on first launch — enter the URL provided by your administrator.
- Sign in with the credentials you were given. The app remembers you on subsequent launches.
- Pick yourself in the Inspector Selector. The Calendar will then filter to your assignments.
- Wait for the initial sync to finish. This is a one-time download of every parcel, codebook, and lookup list — don't go offline until it's done.
- Find your first inspection on the Calendar. Tap the day, then tap a card to open the parcel.
- Open the relevant record from the Records panel and start filling in fields. Save when required fields are complete.
- End the day with a Full Sync from the Calendar's Check for Updates dialog. This guarantees nothing is left in the queue overnight.
Offline → Online Sync Flow
Built for Field ConditionsField Inspection is offline-first. You shouldn't notice connectivity changes during normal work — the app keeps recording everything you do and reconciles with the server when it can. Here's the typical lifecycle:
Where to inspect the queue
The Request Queue Debug page lists every pending and recently completed sync request along with the current connection status. Use it if a sync seems stuck or you want to confirm a particular save made it to the server.
Periodic Inspection — End-to-End
Checklist WorkflowThe most common workflow inside a Periodic Inspection is to walk a checklist of conditions, mark each as you go, and log violations or actions where they apply. Here's the path from open to save:
- Open the parcel from the Calendar or via Parcel Search.
- On the Records panel, tap an existing Periodic Inspection or create a new one.
- Switch to the Checklist tab inside the Periodic Inspection panel. Each row is a condition.
- Tap a condition to open its Checklist Item Detail Page.
- Tap the status indicator to cycle through the available statuses (e.g. Pass, Fail, N/A). Color changes reflect the new state.
- If the condition fails, switch to the Violations tab and tap Add Violation. The new violation is automatically linked to this condition.
- If a follow-up is needed, switch to the Actions tab and tap Add Action. Same auto-linking applies.
- Use the back gesture to return to the checklist and continue with the next condition.
- When you've worked through every condition, tap the green Save button on the Periodic Inspection. A toast confirms.
Printed Forms — What You Get
PDF OutputThe list of templates in the Select Form dialog is configured by your agency, so the exact list varies. Generated PDFs share a common shape across record types:
Complaint
Complaint header, complainant contact, parcel info, narrative description, and any logged inspections or violations.
Permit Application
Applicant and contractor contacts, parcel and zoning details, requested work, and approval decisions captured to date.
Permit
Issued permit details, parcel info, conditions inherited from the application, and a log of inspections performed under the permit.
Periodic Inspection
Parcel info, the inspector and inspection date, every checklist condition with its status, and a footer for signatures.
After generation the PDF opens in a preview where you can share, email, or save it through the platform's standard share sheet. Cancel from the Select Form dialog closes it without generating anything.
Errors & Validation — What to Expect
Feedback PatternsThe app uses a small, consistent vocabulary so it's clear what went wrong and what to do next.
Field-level validation
- Required fields are marked and an inline message in red appears under any invalid field as soon as you leave it.
- Save remains disabled until every required field is valid — there is no failed-save dialog, the button simply doesn't activate.
Toast notifications
- Green toast — operation succeeded (saved, deleted, generated, synced).
- Red toast — operation failed; the message describes what to fix or retry.
- Yellow / progress toast — a long-running task is in flight (sync, attachment download, PDF generation).
Sync failures
A failed sync request stays in the Request Queue Debug page with its error message. The app retries on its own, but persistent failures may need attention from your administrator. No data is lost — the request stays queued until it succeeds or you explicitly clear it.
Session expired
If your token expires mid-edit, the Re-Login overlay appears. Sign back in and you'll resume exactly where you left off; nothing in progress is discarded.